Is the Best Time When Oil and Gas Prices are Up or Down?
A well-rounded petroleum landman should be very familiar with the associated potential pit falls when trying to answer this question, “When is the best time to drill a well.?” One day, most petroleum landmen will find themselves in this situation which can affect oil and gas lease and asset acquisition prices along with the ability to turn a profit when prices are down.
So, who is right and who is wrong? Assuming there are no oil and gas lease issues and other contractual issues, the answer may surprise you. Both are good times to drill.
Example
If your company’s needs are to establish and maintain cash flow rather than being concerned about operating within certain breakeven price point (BEP) guidelines, then drilling when prices are up makes since (take advantage of the IDCs).
If, on the other hand, your company is disciplined not to drill when the ROI economics exceed your set BEP guidelines, then drilling when prices are down makes since. When you stop and think about it, when prices are in an extended downturn period, the cost of oil and gas leases are usually lower, acquisition costs are lower, and drilling and completion costs are lower. If you can keep your LOE costs down, the net recoverable reserves you obtain by drilling in the downturns award you the ability to realize much higher returns and ROIs when prices go back up.
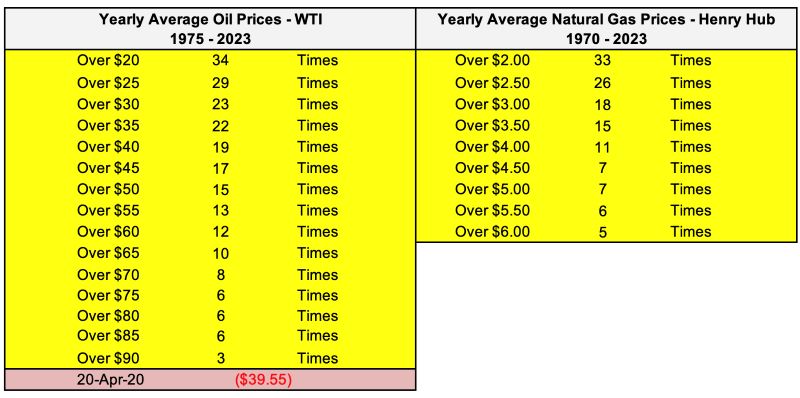
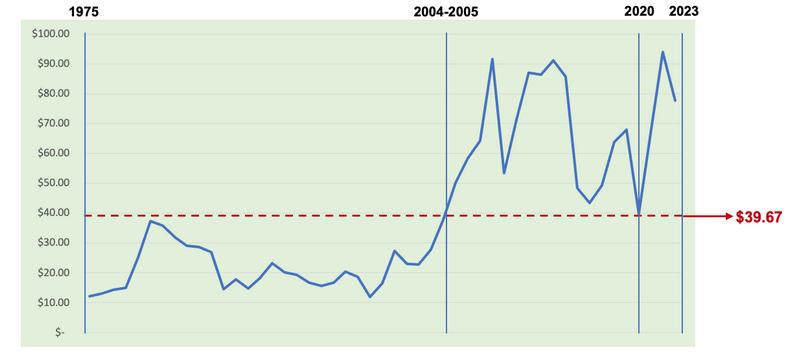
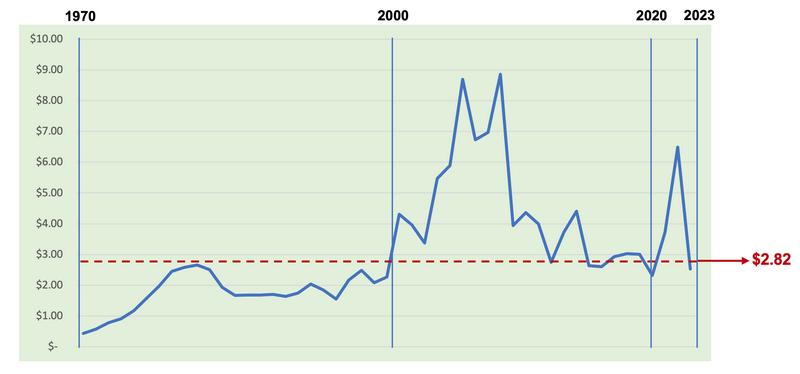
To help clear the air as to how many times oil and gas prices have been higher than usual on a yearly average basis, consider the following chart. This may surprise you but from 1975 – 2023 yearly average oil prices have been between $60 and $65 per barrel (WTI) only 12 times. Yearly average Natural Gas Prices (HH) have been over $3.50 and $4 per mcf 15 times. So, when you are considering drilling based on prices being at a certain level over a 12 to 15-year period (timeframe found in most reserve engineering reports), this price history should be very useful in determining how you would answer the question above.
Average Oil and Natural Gas Prices
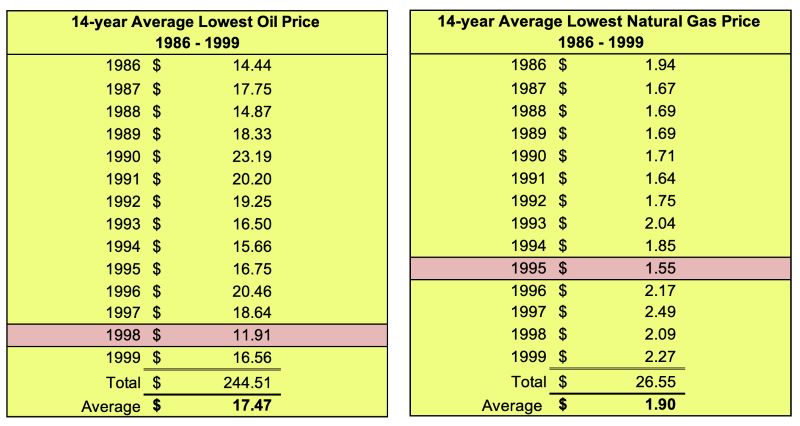
Below is a look at oil and gas prices at their all time lowest from 1986 to 2023 (1986-1999). During this 14-year timeframe, oil averaged $17.47 per barrel (WTI) and natural gas averaged $1.90 per mcf (Henry Hub).
One way to look at it, if you were trying to drill during these times, you BEP for oil should have been 2/3rds of $17.47 = $11.64 per barrel and 2/3rds of $1.90 = $1.26 per mcf. You may ask, is that possible and is it possible today?
14-Year Average Lowest Oil Price
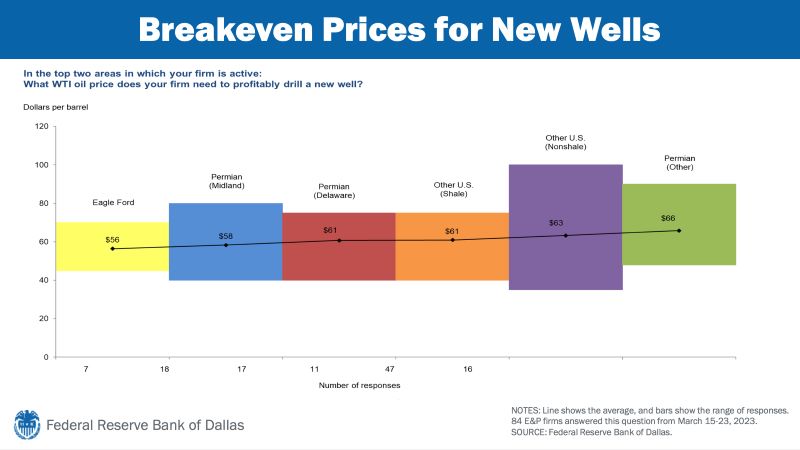
When our company was drilling and operating wells is Santa Barbara County, CA during most of this timeframe, our all in BEP was $4 per barrel and $0.30 per mcf. We were able to achieve this by outsourcing much of our overhead and accounting costs, thus keeping our overhead down. Also, we took advantage of the extremely low drilling and completion costs as well as extremely low lease and other acquisition costs. Today (2024), our AFE and ACQ BEPs are around $13 per barrel and $0.94 per mcf. So, yes it can be done to a large and safe degree. Larger companies may have trouble hitting those BEPs. For example, below is an image of the Federal Reserve Bank of Dallas’ 2023 for the nations average BEP for new oil wells.
Breakeven Prices for New Wells
Below is a good example as to how we look at BEPs today (2024) - Average oil price from 1975 – 2023 = $39.87- Average natural gas price from 1970 – 2023 = $2.82:
AVERAGE OIL PRICE
AVERAGE NATURAL GAS PRICE
EXAMPLE BEP (2024)
100,000 net recoverable barrels of oil per well = $19.83 per barrel (BEP).
2/3rds for AFE and ACQ = $13.22 per barrel ($1.32 million - attributable to size of the spacing unit)
1/3rdfor LOE = $6.61 per barrel ($661,139 over 15 years per well)
4 bcf net recoverable gas reserves = $1.41 per mcf (BEP).
2/3rds for AFE and ACQ = $0.94 per mcf ($3.75 million - attributable to size of the spacing unit)
1/3rdfor LOE = $0.47 per mcf ($1.87 million over 15 years – per well)
A cautionary tale is to be careful in using a PV10 or PW10 value to help establish your BEP when oil and gas prices used in a Reserve Report are based on higher-than-normal levels. For example, the yearly average oil and gas prices for 2022 were $94.03 per barrel (WTI) and $6.49 per mcf (Henry Hub). However, when you looked at the previous 6 years (2015 – 2021), those yearly average prices were $54.32 per barrel and $2.89 per mcf. So, using the higher price points in your ‘Strip Forward’ pricing points in the reserve reports can be very risky and probably not achievable for a long period of time.
In the end, when is the best time to drill depends on your company’s needs and wants. Three things to remember are Perception, Desire, and Justification. Perception: How do you perceive the project before and after you have reviewed the data? Desire: At what level and when do you desire to move ahead with investing in the project? Justification: How do you justify moving along with investing in the project before and after you have reviewed the data?
There are many factors in making the decision as to when is the best time to drill. Food for thought, the best time to purchase drilling prospects, oil and gas leases, and drill is when prices are down.
To learn more about with different critical title issues, visit our website at www.InstituteOfEnergyManagement.com. View our course catalog and chose our Valuation Essentials Course, our Understanding PUDs course, and/or our Successful Negotiations course.

